Product Telemetry: What User Behavior Really Tells You
Users rarely tell you what they need. Their behavior does.
Ask someone what they want and you’ll get an honest answer – just not always the right one. People say they’ll use a feature every day, then never open it again. They ask for more options, then get lost in the ones they already have. Product telemetry closes that gap. It shows what people actually do inside your product, not what they remember doing or wish they’d done.
This matters more than ever. Product teams now sit on more usage data than at any point before, yet most roadmap decisions still get made the old way: by opinion, by the loudest stakeholder, or by whoever pitched the idea last.
This article breaks down what product telemetry actually measures, how it differs from customer feedback, and how to build it into a product from day one instead of bolting it on after growth arrives.
1. Why Most Roadmaps Still Run on Opinions, Not Evidence
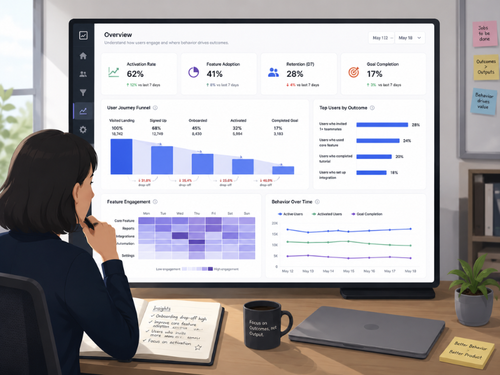
Most product roadmaps are still built on opinions – the loudest customer, the most senior stakeholder, or a competitor’s latest release. Product telemetry replaces that guesswork with a record of what users actually do inside the product. That record is what separates a roadmap that reacts to noise from one that compounds real value over time.
Roadmap prioritization is famously hard, and a big reason is stakeholder opinion. Everyone has a view on what should ship next, and not everyone’s view carries the same weight once you look at what users are actually doing with the product. Frameworks built on data give teams a reason to say no to a “good” idea in favor of a “great” one, which is exactly the discipline data-driven prioritization is meant to protect.
None of this means opinions are worthless. Vision, taste, and product instinct still matter, especially early on. The problem shows up when a team never checks its instincts against what the product’s own usage data says – and keeps shipping the same kind of feature long after the telemetry shows users have stopped touching it.
2. What Product Analytics Actually Measures
Product analytics is the practice of tracking how people interact with a digital product – which features they touch, where they drop off, which cohorts return, and how all of that shifts as the product changes. It turns product usage into a measurable, queryable dataset instead of a collection of anecdotes.
A handful of metrics show up across almost every product, regardless of industry:
- Feature adoption rate – the share of users who try a given feature after it ships
- Funnel conversion – the percentage of users who complete a defined sequence, like onboarding or checkout
- N-day retention – whether users come back 1, 7, or 30 days after signup
- DAU/MAU stickiness – how often active users return within a given month
- Session depth – how far a user gets into a session before leaving
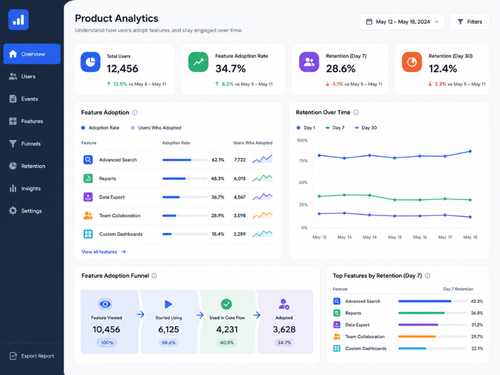
The scale of this data has grown fast. Mixpanel’s 2026 State of Digital Analytics report, drawn from more than 12,000 companies and 3.7 trillion tracked events, found that the product itself has become the primary channel for acquisition, engagement, and retention – not a side effect of marketing or sales. And the gap between products that use this data well and those that don’t is wide: Amplitude’s 2025 benchmark work found that top-performing products see roughly four times the day-one activation of the median product (21% versus 5%).
3. Behavioral Signals vs. Customer Feedback: What Each One Tells You
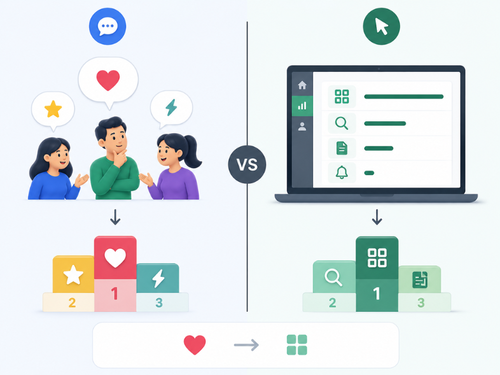
Behavioral data and customer feedback answer two different questions, and neither one alone gives you the full picture. Feedback tells you what users think and feel about your product. Behavioral data tells you what they actually do with it – and the two frequently disagree.
| Customer feedback | Outcome-driven team | |
|---|---|---|
| What it captures | Opinions, requests, frustrations users are willing to say out loud | Actions users take, whether or not they’d mention them |
| Strength | Explains the “why” behind a pattern | Shows the pattern in the first place, at scale |
| Blind spot | Vocal minority, recency bias, social desirability | No context on intent, emotion, or unmet need |
Superhuman’s founder Rahul Vohra built one of the better-known examples of combining the two. His team didn’t just survey users about product-market fit – they first filtered for people who had used the product at least twice in the previous two weeks, a behavioral threshold, before asking how they’d feel if the product disappeared. The survey gave direction; the usage filter made the answers trustworthy.
Netflix is the more extreme version of the same idea. Its recommendation engine runs entirely on behavioral telemetry – what people watch, pause, skip, and rewatch – and Netflix’s own engineers have said that personalization and recommendations save the company more than $1 billion a year through reduced churn. No survey could have produced that number. Only the behavior could.
4. Building Telemetry Into Your Product From Day One
Telemetry works best when it’s part of the architecture from the first release, not something bolted on after a growth review flags a blind spot. Retrofitting tracking into a product that already has real users is slower, messier, and leaves gaps in exactly the historical data you’ll want later.
A few habits make this easier to get right early:
- Define north-star events before writing code. Decide what “activation” or “value delivered” looks like for your product before the first feature ships, not after.
- Instrument at the event level, not the page level. Page views tell you someone arrived; events tell you what they did once they got there.
- Tag events by account, not just by session. This matters most for B2B products, where the buyer, the admin, and the daily user are often different people.
- Pipe the data somewhere queryable from day one. A spreadsheet works at ten users. It does not work at ten thousand.
- Build privacy and consent into the schema, not around it. For teams selling into the EU, Switzerland, or regulated industries, this is far cheaper to design in at the start than to retrofit before an enterprise security review.
Investment in this kind of infrastructure keeps climbing. The product analytics market is projected to grow from roughly $5.3 billion in 2026 to $12.7 billion by 2033, a sign that more teams are treating telemetry as core infrastructure rather than a nice-to-have add-on.
5. Turning Telemetry Into Roadmap Decisions
Telemetry only pays off when a team has a habit of turning numbers into decisions, not just dashboards nobody revisits after the launch review. Data sitting in a tool nobody opens is no better than no data at all.
To make that habit stick:
- Set thresholds before you look at the data. Decide in advance what result would justify shipping, killing, or reworking a feature – deciding after you’ve seen the numbers invites motivated reasoning.
- Review dashboards on a fixed cadence, not only during incidents. Weekly or biweekly reviews catch slow declines that a single crisis review would miss.
- Pair every roadmap item with the metric it’s meant to move. If a feature can’t be tied to a metric, that’s worth questioning before it’s built, not after.
- Revisit the metric after shipping. Confirm the feature actually moved what it was supposed to move before calling it done.
A useful discipline here is being able to answer, in one sentence, who cares about a given signal, how much, and why now – if a team can’t answer that, it’s usually reacting to noise rather than a real pattern.
6. Common Mistakes Teams Make With Product Telemetry
Even teams that adopt product telemetry tend to get it wrong in a few predictable ways.
- Tracking everything, analyzing nothing. Instrumenting hundreds of events without a plan for reviewing them just moves the noise from qualitative to quantitative.
- No clear owner of the data. If no one is accountable for the dashboards, they quietly go stale within a quarter.
- Ignoring account-level patterns in B2B products. A single power user can make an entire account look “engaged” while everyone else has churned out mentally.
- Leaning on vanity metrics. Total signups and pageviews look good in a slide deck; they rarely predict retention or revenue.
- Never connecting usage data back to revenue. Behavioral data is most persuasive to leadership when it’s tied to outcomes like expansion, retention, or reduced support load – not just engagement for its own sake.
How IMT Solutions Helps Teams Build Telemetry Into Their Products
Building telemetry that actually gets used takes more than adding a tracking script. It means designing the data model, the event schema, and the pipeline so that product, engineering, and analytics teams are all working from the same source of truth – and doing it in a way that holds up under GDPR, FINMA, or other regulatory reviews when the product sells into regulated markets.
IMT Solutions works with founders and enterprise engineering teams across BFSI and healthcare If you’re planning how to instrument a new product or rework an existing analytics setup, our case studies show how we’ve approached similar problems for other clients, and our blog covers more of how we think about product and engineering decisions like this one.
Contact our team to talk through where your product’s data stands today – and what it would take to make it work harder for your next roadmap.
Frequently Asked Questions
What’s the difference between product telemetry and product analytics?
Product telemetry usually refers to the raw event data collected from a product – clicks, API calls, feature usage. Product analytics is the layer on top that turns that raw data into metrics, funnels, and cohorts a team can act on.
How much telemetry should a startup build before launch?
Enough to measure activation and the two or three actions that define value in the product – not a full analytics platform. Early-stage teams should track the events tied to their north-star metric first and expand from there.
Does product telemetry replace user interviews? No. Telemetry shows what users do; interviews explain why. The strongest product decisions still combine both, especially when behavior alone can’t explain a pattern